Graph my organization
About the project
Graph my organization is a side project I built for a hackathon. I developed and designed this app from scratch. As a data visualization, this app demonstrates a high skill cap in frontend ability, which is why I chose to do it.
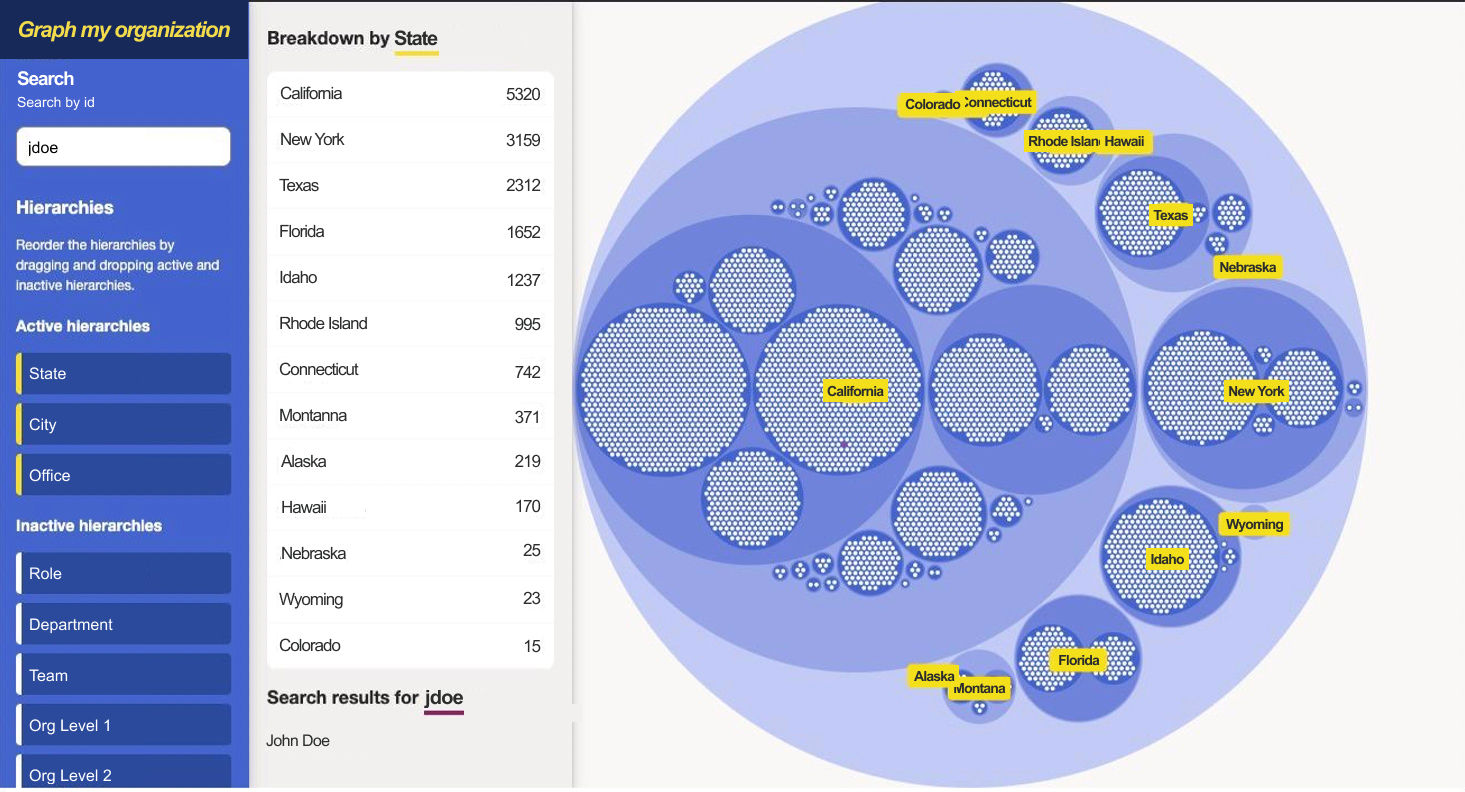
On the left panel, you can search an individual or rearrange the breakdown of the visualization. In the bubble chart, you start at the top level to see everything, but can click and zoom in to any level or drill down.
Technical Details
- React, single page app.
- React-d3js
- D3 Bubble chart
- React-beautiful-dnd
- Indeed's design system theme and components.
- Cross-browser tested
One of the challenging parts was getting the html text to show up perfectly centered and still animate in and out when you deep dive a level in the bubble chart.
I was also surprised with how well React and React state worked with D3.